A process in which data is touched, cared for, and made ready
Leman Çelik
.JPEG)
History – What are these 64 electrodes?
In a biopsychological laboratory studying memory and the lateralisation of brainactivity through EEG, data production does not begin with recording. It begins with preparation. A 64-channel EEG cap is placed on a participant’s head, its silver chloride electrodes distributed across the scalp. Before any signal can be measured, each electrode must be individually adjusted.
In the laboratory, the researcher first takes a measuring tape and measures the research participant’s head in order to select the appropriate cap. Once the cap is placed, the preparation to produce the data begins. The researcher movest heir hands through the participant’s hair, parting and repositioning it to reach the scalp, and starts applying conductive gel into each of the electrode ports using a syringe.
This is an intimate and careful process, requiring repeated contact with the participant. Too little gel prevents conductivity, too much disturbs the signal. The gel must also be fresh, not dry. Each electrode is handled in turn, checked, and readjusted if necessary.
In this process, care operates on multiple levels at once: care for the participant and care for the data are inseparable. They are enacted through different practices through which data is produced.
Capabilities – What can 64 electrodes do?
Data is not given, but brought into form through practice and ongoing processes of translation.
As gel is applied and electrodes are adjusted, attention shifts to the computer screen running the Brain Vision software used in EEG recordings. Here, each of the 64 electrodes appears as a coloured circle, indicating the quality of the connection and forming a virtual interface through which these connections are monitored. At first, most circles are red. As preparation continues, they begin to change; from red to yellow, and eventually to green.
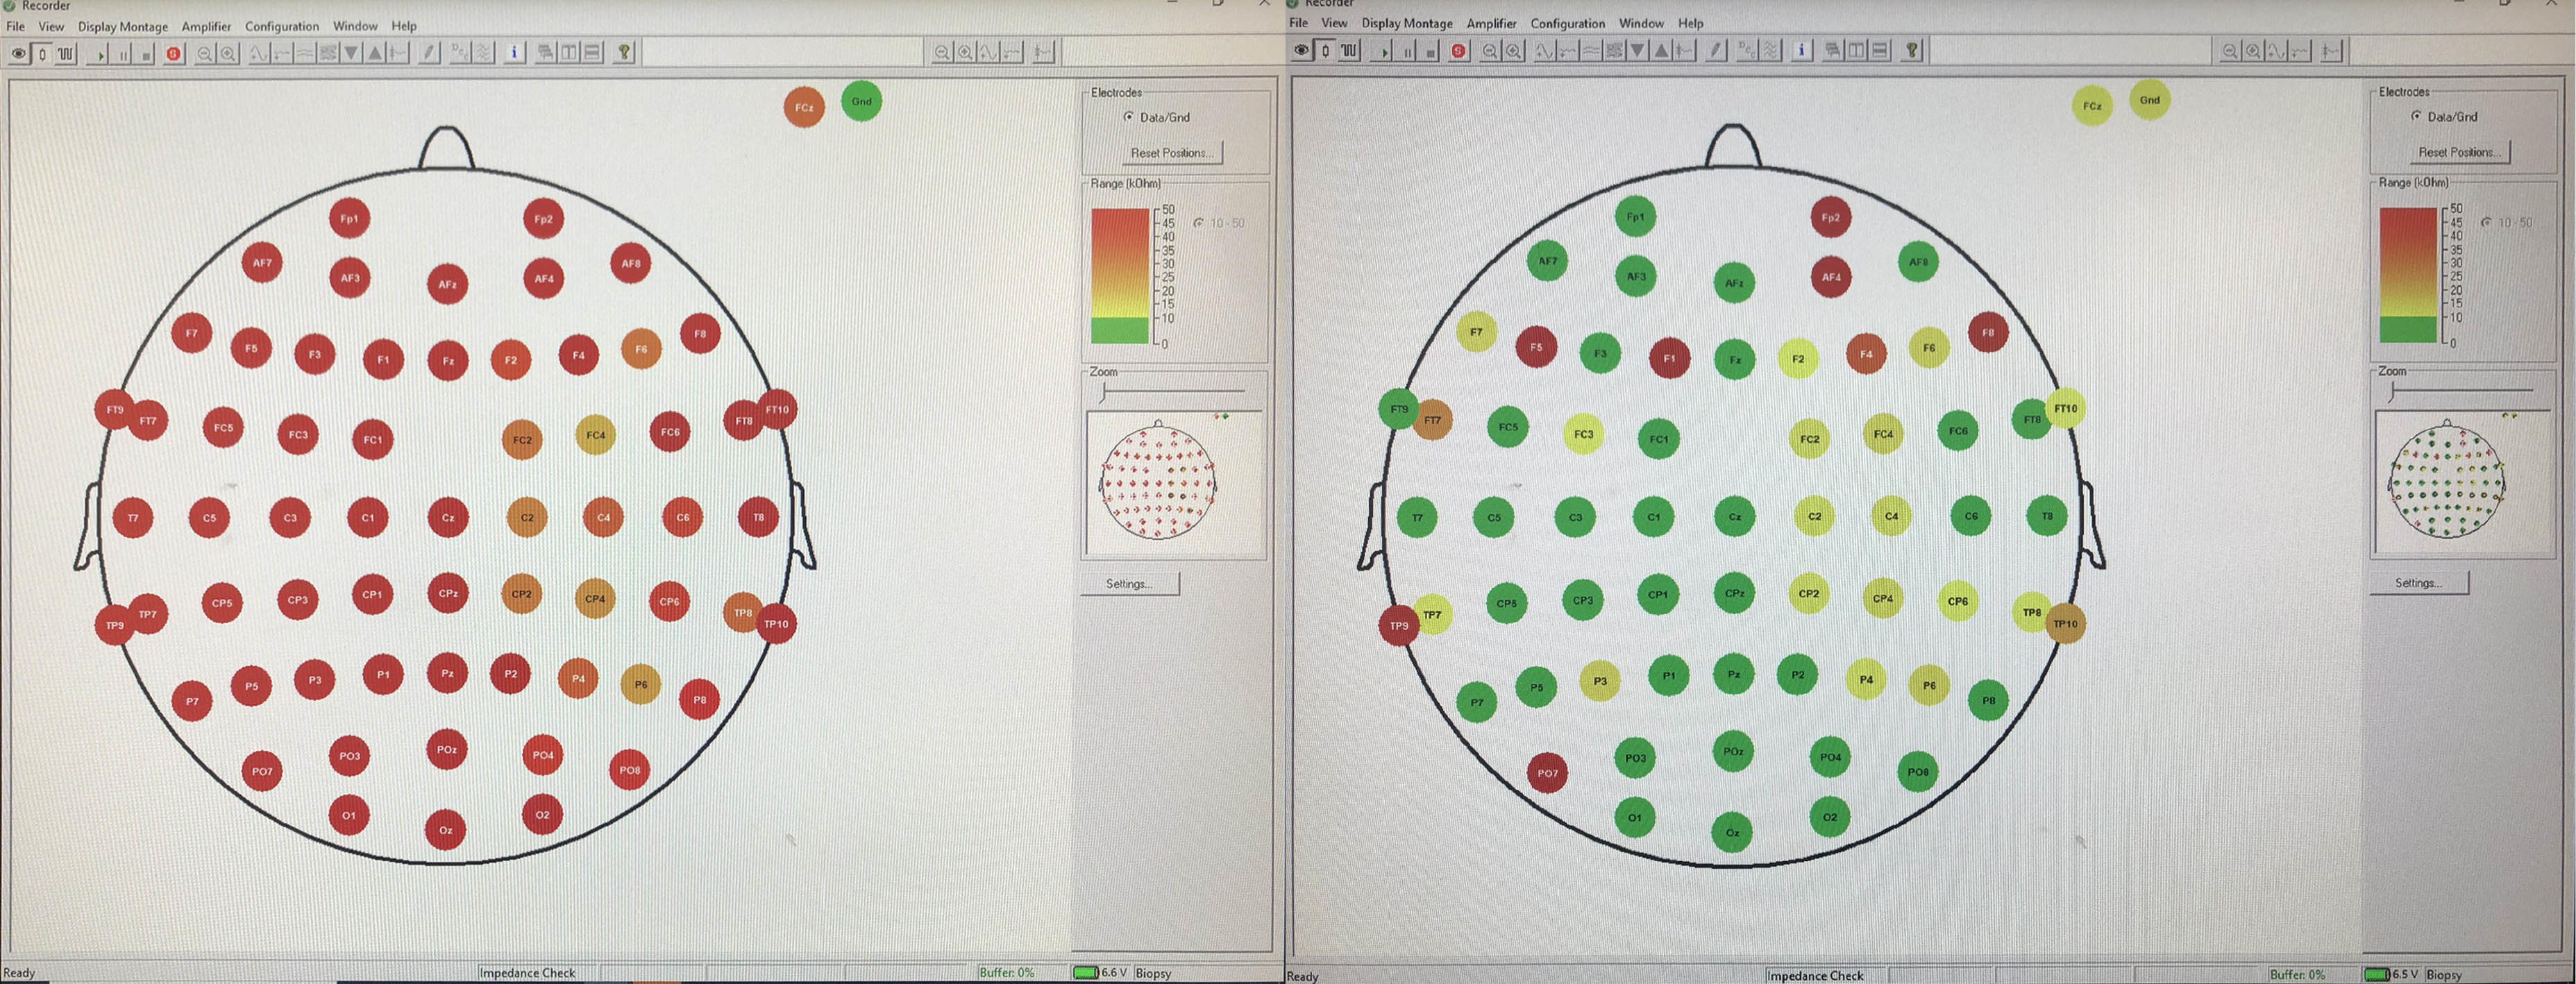
These changes do not simply reflect technical calibration; they indicate the gradual establishment of relations between body, material, and device. Each shift in colour marks a small achievement: a contact stabilised, a connection secured.
This process is deeply tactile. Data begins with touch: hands moving through hair, electrodes pressed against skin, gel inserted to create conductivity. In these moments, the researcher establishes a close and attentive relation with the participant, working directly on and with the body. It is through these acts that data is produced. Each electrode requires attention, monitoring, and repeated adjustment until the connection holds.
This is a practice of care. In this sense, data is not raw (Gitelman, 2013). It is handled, stabilised, and brought into form; what can be understood as caring for data (Puig de la Bellacasa, 2017), touching data, and cooking data into a measurable signal (Biruk, 2018). Like ingredients in a recipe, data requires careful preparation, timing, and balance before it can take a measurable and analysable form.
These practices are embedded in data infrastructures that coordinate bodies, materials, and software in real time (D’Ignazio & Klein, 2020). Within these infrastructures, brain activity is not directly accessed but transformed into digital traces that circulate as virtual representations of neural activity. Data is translated across multiple steps: from neural activity to electrical conductivity, from conductivity to digital traces, and from traces to analysable outputs. It takes form through these practices and the chains of translation (Latour, 1999) they sustain.
Findings – What do these 64 electrodes show?
The 64 electrodes make visible how scientific knowledge depends on intertwined processes in which data, practices, and infrastructures co-produce one another.
The shift from red to green marks a threshold, not just of technical readiness, but of epistemic possibility. Each green indicator on the screen signals that relations between scalp, gel, sensor, and software have been sufficiently aligned for the electrode to reliably measure electrical brain activity, allowing data to become analysable and comparable. What appears as a simple colour change is in fact the result of sustained material and practical work.
This alignment is neither automatic nor isolated. It is part of a chain of translations (Latour, 1999) in which signals are continuously transformed across bodies, devices, and representational forms. At each step, something is adjusted, stabilised, and made to hold. Scientific knowledge is produced through these intertwined processes in which infrastructures, practices, and interpretations are tightly interwoven.
By foregrounding these often-overlooked practices, the 64 electrodes show that data does not pre-exist its production. It is achieved through ongoing acts of touching, caring, and stabilising; processes embedded in data infrastructures that are fundamental to how scientific knowledge is produced and maintained across 64 electrodes.
Literature
Biruk,C. (2018). Cooking data: Culture and politics in an African research world. Duke University Press.
D’Ignazio, C., & Klein, L. F. (2020). Data feminism. MIT Press.
Gitelman, L. (Ed.). (2013). »Raw data« is an oxymoron. MIT Press.
Latour, B. (1999). Pandora’s hope: Essays on the reality of science studies. Harvard University Press.
Puigde la Bellacasa, M. (2017). Matters of care: Speculative ethics in more thanhuman worlds. University of Minnesota Press.
Das Virtuelle Objekt des Monats
Seit April 2023 stellen wir jeden Monat ein »Virtuelles Objekt des Monats« (VOM) auf der Website des Sonderforschungsbereichs 1567 »Virtuelle Lebenswelten« vor. Die präsentierten Objekte entstammen der Forschung in den Teilprojekten. Im Zusammenspiel von Text und Animation, desktop- oder smartphonebasierter Augmentierung oder anderer grafischer Aufbereitungen eröffnen wir Einblicke in die verschiedenen Forschungsthemen und den Arbeitsalltag des SFB. Das VOM macht unsere Wissensproduktion transparent. Zugleich wollen wir hier mit den Möglichkeiten und Grenzen der Wissensvermittlung in und durch Virtualität und Visualität experimentieren.
Das »Virtuelle Objekt des Monats« ist mehr als ein populärwissenschaftlicher Text und mehr als ein illustrierendes Bild. Die Autor*innen des jeweiligen VOM präsentieren kurz einen Gegenstand ihrer Forschung um daran ein Argument scharfzustellen. Dabei werden die Objekte auf ihren Mehrwert hin befragt, den sie in dem jeweiligen Forschungssetting preisgeben. Mit dem Text skizzieren unsere Wissenschaftler*innen das Bemerkenswerte, das Eigentümliche oder auch das Einzigartige, welches das jeweilige Objekt zeigt. Sie machen so die Forschung des SFB in einem kurzweiligen Schlaglicht sichtbar. Die zum VOM gehörende Visualisierung ist eine weitere Transformation des Forschungsgegenstands, die das Argument noch einmal auf eine andere Art und Weise zugänglich macht.


